 When I was first licensed in the 1990s, if a house didn’t sell for a period of time like 30 or 60 days, we would often reduce the price. Sometimes it was because we had too few showings, or because the showings we had didn’t yield any offers. On occasion, some home sellers would voice concern at a price change because no one had seen the house to give them price feedback. We’d have to explain that the feedback was the actual absence of showings. It wasn’t a truly data-driven process, however, because we had no means of measuring who saw the house either through their agent’s analog means (like seeing it in a broker’s binder) or advertised in publications and passed on it. We did have ample evidence that once a price was reduced, that the market responded.
It’s very different today. We have a number of digital means of measuring the interest -or lack of it- in a listing based on online metrics.
A few examples:
- Web traffic. We have access to dozens of websites that can inform us how many people have viewed the property, saved it, and if they viewed it multiple times. Zillow, Trulia, Realtor.com, our own website, and our client platforms all have some form of revealing the listing’s performance.
- Saved or Bookmarked listings. The same online assets can also tell us how many people added a listing to their favorite or saved list.
- Proprietary client portals stats. Often when a buyer client is working with an agent, that agent’s brokerage has an online client platform (ours is called RealScout) that tells us when a particular listing is opened or saved. This is not like raw web traffic. These are active clients who have a representation contract with an agency and have a login to a concierge type site that gives us rich data on a listing’s performance.
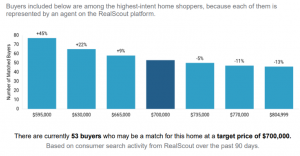
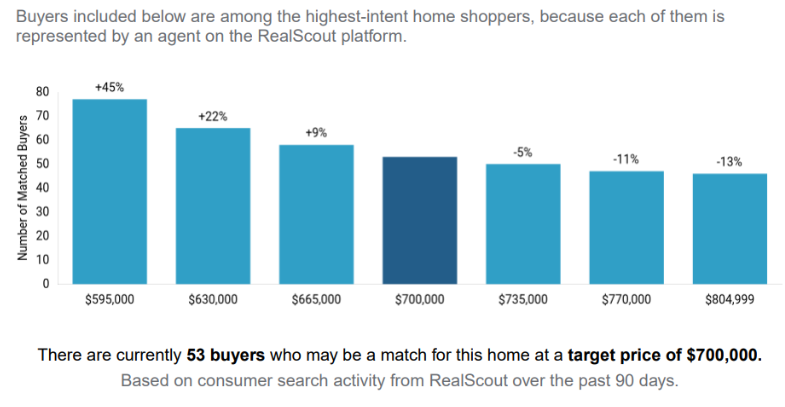
- Predictive analytics. This is crazy stuff. The program uses big data and is enhanced by AI, and can give us a far deeper dive into activity around a listing, and also tells us how many registered clients would likely save or match up with a listing by an algorithm fueled by web behavior. Simply put, it will tell me that a listing will garner 40 interested parties at $840,000 but 65 interested parties at $799,000. This is extremely data-driven and granular.
- Reverse prospecting. This is in the back office of the MLS and gives a listing agent a list of every instance where a fellow MLS member has sent this listing to a client.
Given that with virtual tours, floor plans, high resolution photos and even drone imaging every listing is virtually an open house online 24/7, we can therefore see if the listing’s performance is in sync with the online metrics, or if a price reduction is in order. Let’s take, for example, two similar listings with comparable characteristics; one is priced at $699,000, the other at $729,000. The 699 home has 500 unique views, 25 favorites, 20 showings the first two weeks, 35 reverse prospecting matches, and 2 offers. The 729 house has 350 unique views, 3 favorites, 8 showings the first 2 weeks, 15 reverse prospecting matches, and one offer below asking. It doesn’t take much to conclude that $729,000, even in this market, is too high.
If a home is under performing on the market, the seller should ask their agent to see the data on the home’s online metrics with consumers. The agent should be able to compare their performance with a comparable property, and even use the predictive model to see what would change with a price improvement. The math defines the path- armed with data, the agent and client should be able to know what the best move should be for pricing.
Upon occasion, we are asked by the seller if the perception of the public will change with a price drop. The concern is that the seller might appear desperate or something like that. Soon, I will write a piece on the things we overthink in this industry. That question will be prominent. In this market, those fears evaporate when the buyer competition heats up with a correctly priced listing.

 Facebook
 X
X
 Pinterest
 Copy Link


